Graphic Design
Just the Fact 2
By Jane Sun on June, 2017
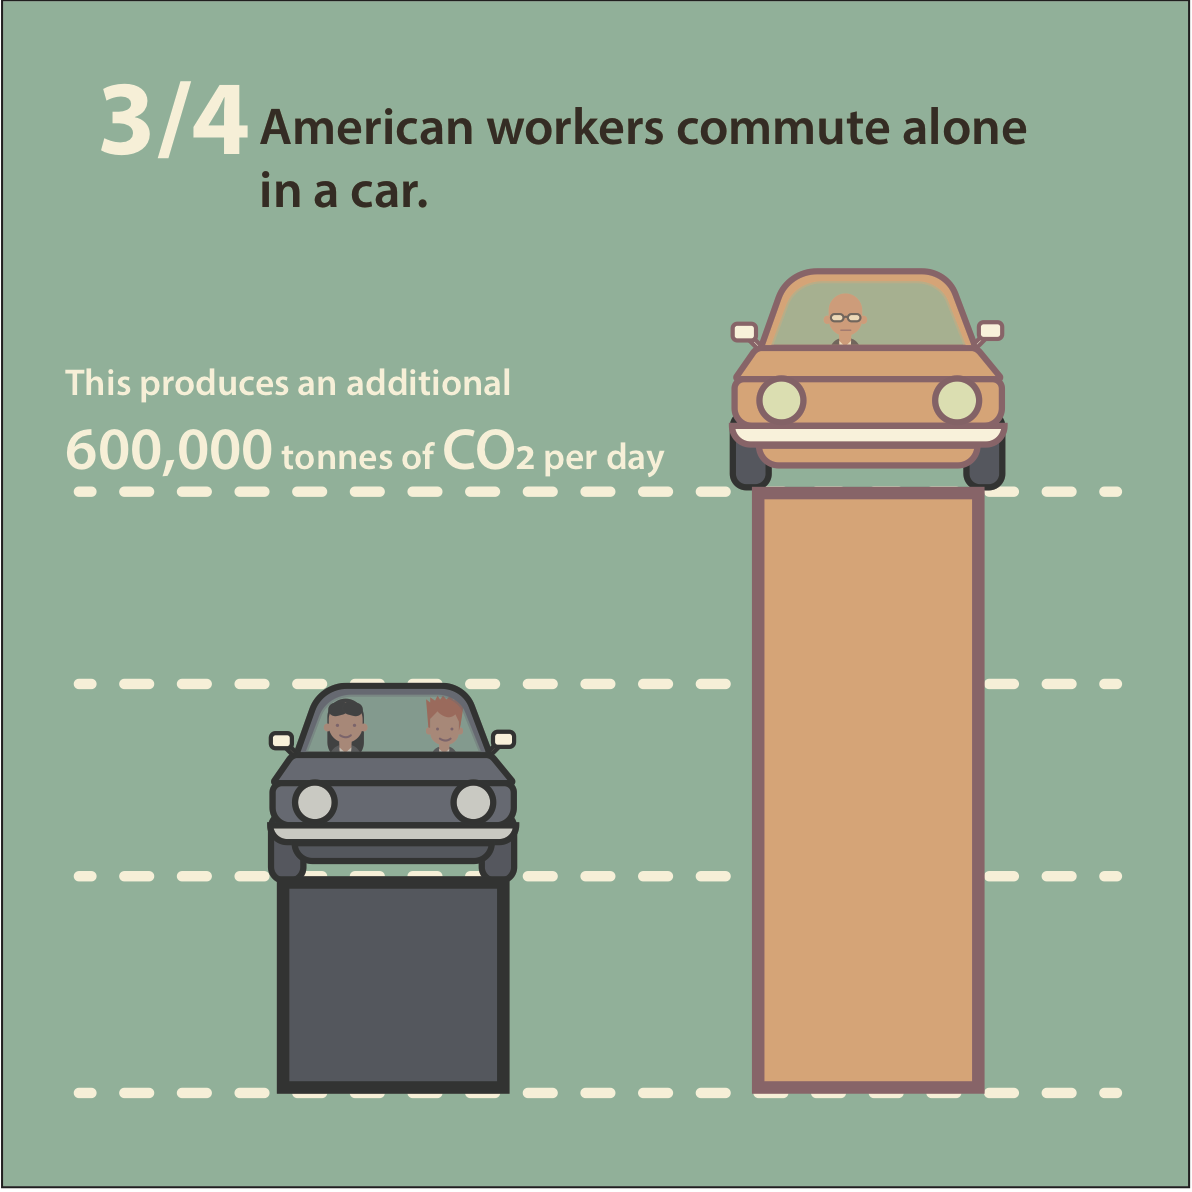
An infographic exploring proportion-based data visualisation. The source fact was sparse, so the first step was to enrich it with context: using total U.S. worker figures and average per-car CO₂ emissions, I calculated that solo commuting generates approximately 600,000 extra tonnes of greenhouse gas compared to a scenario where each driver shared with just one other person. Grounding the abstract statistic in that concrete counterfactual gave the graphic a clear argument rather than just a number.
A bar chart compares solo versus shared commute rates, making the proportion immediately visible. The green background evokes sustainability and the natural world, while the yellow foreground carries the warning — a deliberate contrast between what is and what could be.